RICHMOND, VA. Governor Abigail Spanberger has launched a statewide tour to develop Virginia’s first comprehensive economic-development policy of the new administration, the Office of the Governor announced May 11. For every county Economic Development Office and independent-city economic-development authority in the Commonwealth, this is the highest-leverage moment of the year.
Executive Order 15 establishes a Cabinet-level Steering Committee chaired by Secretary of Commerce and Trade Carrie Chenery. Over the coming months, the Governor and her Cabinet will host listening sessions across Virginia with business leaders, industry experts, education partners, and the local economic-development professionals who know their jurisdictions best. 2 sessions have already been held, in Harrisonburg and Fairfax. The Office of the Governor said additional sessions will be held across the Commonwealth in the coming months.
The executive order names 3 pillars:
- Supercharging Virginia’s Business Growth
- Growing an Economy that Delivers for Every Virginian
- Leading the Way in a Changing Economy
Each pillar is a question the state will be asking 133 Economic Development Offices to answer about their own jurisdiction. The Economic Development Offices that come with answers, backed by current data, will help set the regional priorities.
The Labor-Market Backdrop
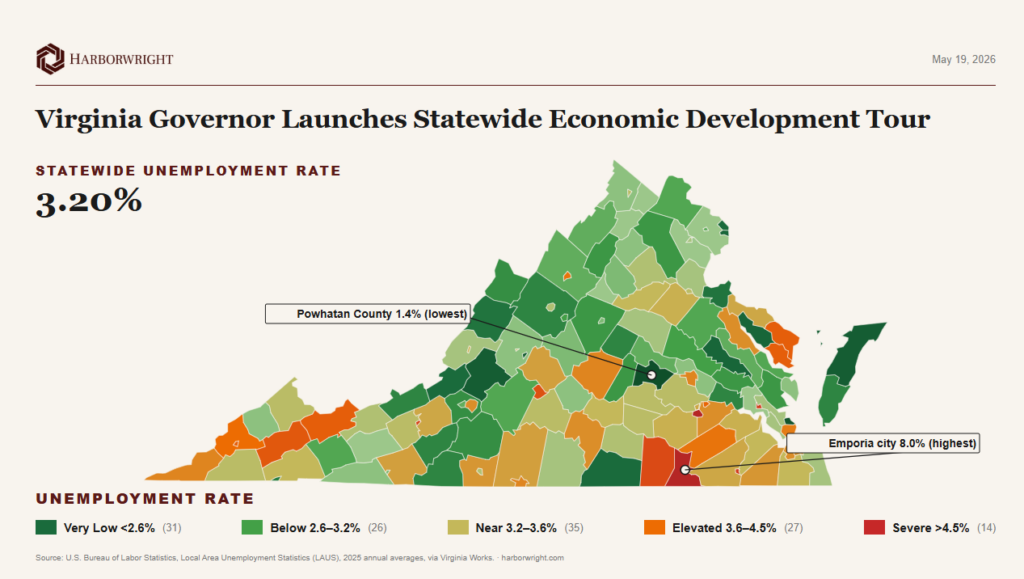
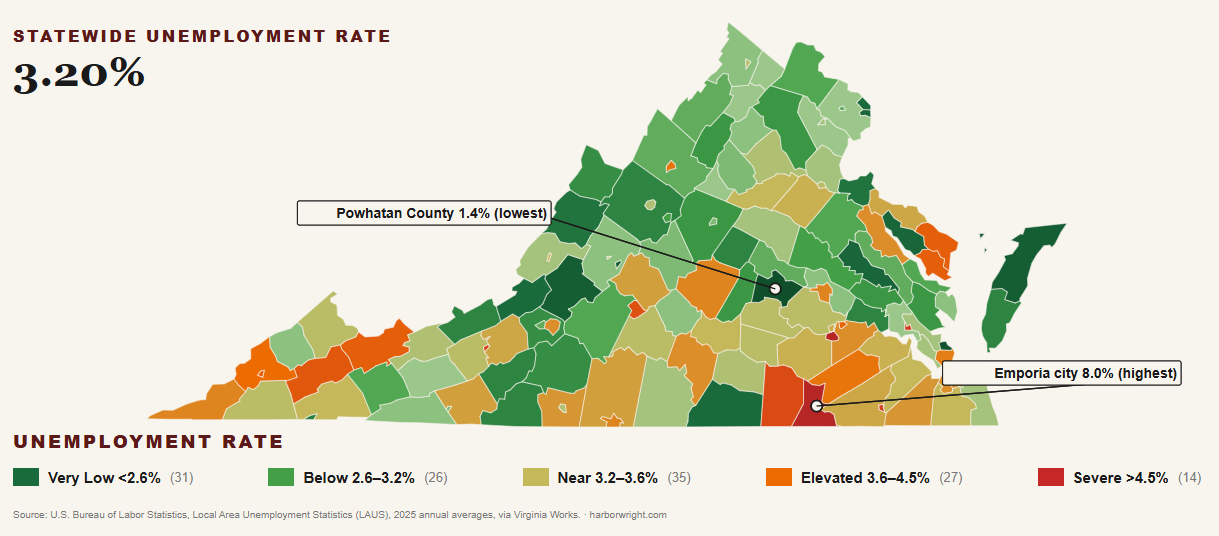
Virginia’s 2025 annual unemployment rate, BLS reported, was 3.20%, below the 4.3% national figure. That headline is the figure every press release will quote. It is also the figure that hides what is actually happening in 14 Virginia jurisdictions where, on any given week of 2025, more than 1 in every 22 working-age adults could not find a job.
Powhatan County, an exurb on the western edge of the Richmond metro, recorded an annual average of 1.40%. For business owners in Powhatan, that figure is not a data point. It is the daily reality of fielding 3 job postings against the same skilled-worker pool. Emporia city, a small independent jurisdiction of roughly 5,800 people on the North Carolina border, recorded 8.00%. For Emporia’s families, that figure is roughly 230 working-age adults without a paycheck in a city the size of a single Northern Virginia high school.
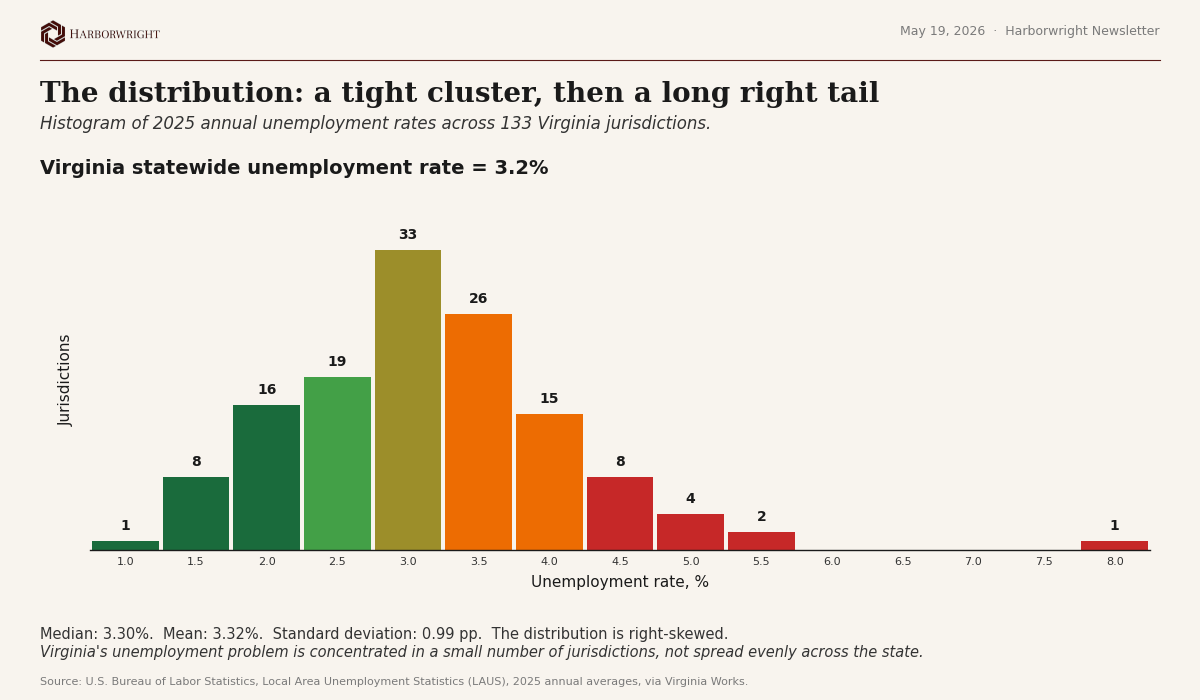
Between Powhatan and Emporia sit 131 other counties and independent cities, distributed unevenly across the state. The unweighted mean across jurisdictions is 3.32%. The median, 3.30%. The standard deviation, 0.99 percentage points. The distribution is right-skewed: most of Virginia clusters between 2.5% and 4.0%, but a small number of localities sit well above the state’s headline rate. 14 jurisdictions reported 2025 unemployment above 4.5%, roughly 1 in 10. Where they cluster determines what each of the executive order’s 3 pillars will need to confront on the ground.
The Landscape
The map below colors each of Virginia’s 133 jurisdictions by 2025 annual unemployment rate. Darker greens denote rates below the statewide 3.20% figure. Oranges and reds denote rates above it. Green concentration across Northern Virginia and the Shenandoah Valley. Orange and red concentration across Southside and Southwest Virginia.
The Extremes
Among the 10 jurisdictions with the highest 2025 unemployment rates, 6 are independent cities: Emporia (8.00%), Petersburg (5.90%), Williamsburg (5.20%), Franklin (5.20%), Radford (5.10%), and Lynchburg (4.90%). The 4 counties on the list, Greensville (5.90%), Brunswick (5.00%), Russell (4.80%), and Lancaster (4.70%), are concentrated in Southside and far Southwest Virginia. The arithmetic is geography. The arithmetic is also the working-age population those cities and counties are losing.
Among the 10 lowest are Powhatan County (1.40%), Poquoson city (1.50%), Manassas Park city (1.60%), Accomack County (1.70%), Botetourt County (1.70%), Buena Vista city (1.70%), King William County (1.90%), Richmond County (1.90%), Alexandria city (1.90%), and Arlington County (2.00%). 6 of the 10 are exurban or rural counties on the fringe of larger metros. Their residents work elsewhere. Their employers compete for labor against entire metro regions.
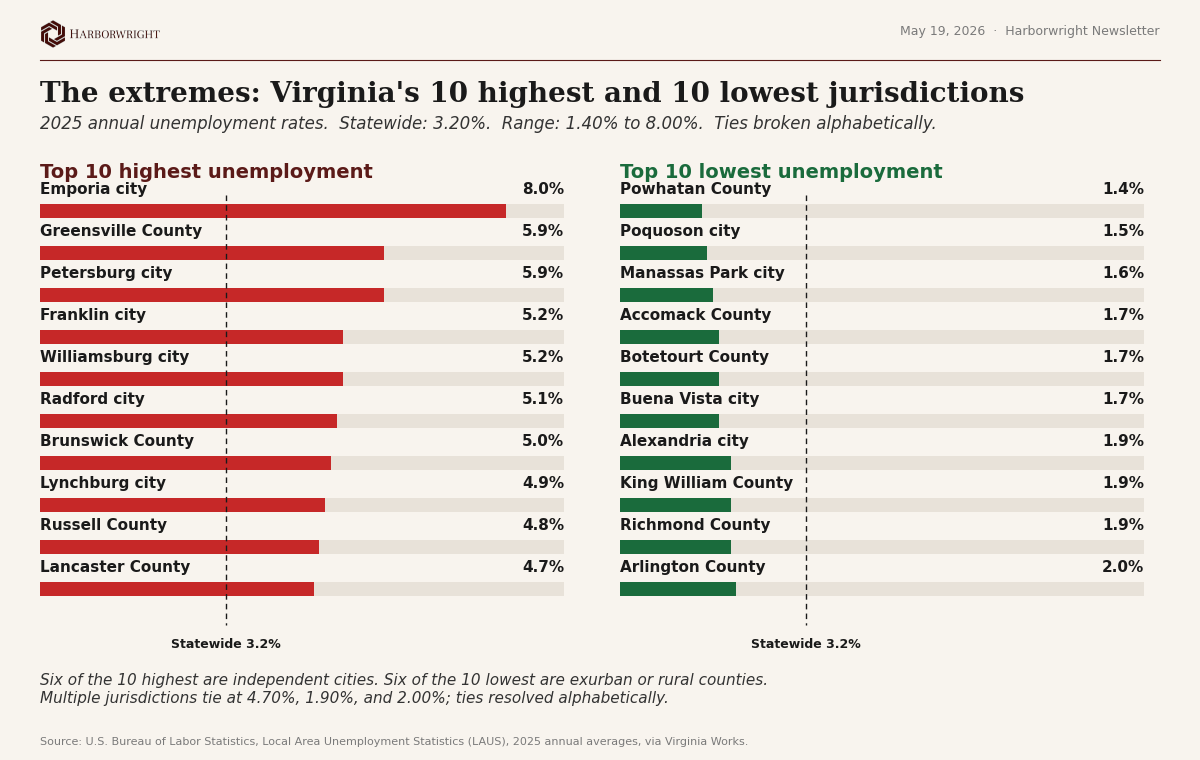
Independent cities dominate the high-unemployment list because Virginia’s independent-city geography includes several small, economically narrow jurisdictions tied to a handful of employers, a hospital, a community college, a single industrial site. When one shrinks, the local rate moves visibly. The low-unemployment list is dominated by exurban counties on the periphery of Northern Virginia and Richmond, places where labor-force participation is high, commuting is the norm, and the local rate reflects a regional metro labor pool rather than a self-contained local economy.
The Distribution
59% of jurisdictions, 78 of 133, sit between 2.5% and 4.0%. Beyond 4.5%, the count drops sharply: 14 jurisdictions total, with only 1 (Emporia city) above 6.0%. Virginia’s unemployment problem is not statewide. It is concentrated in a small number of jurisdictions with identifiable structural conditions: small populations, narrow industry bases, limited proximity to larger labor markets.
For state policy, this means targeted intervention beats broad-based programs. For an Economic Development Office, this means the comparable set is not “all of Virginia”. It is the 5 to 15 jurisdictions sitting near your tier. The tour sessions will sort the Commonwealth into those tiers in real time. The arithmetic of who shows up prepared will determine which tier each region falls into in the final policy framework.
The Geography
Aggregated to Virginia’s 5 primary economic regions, the pattern resolves into a clearer story.
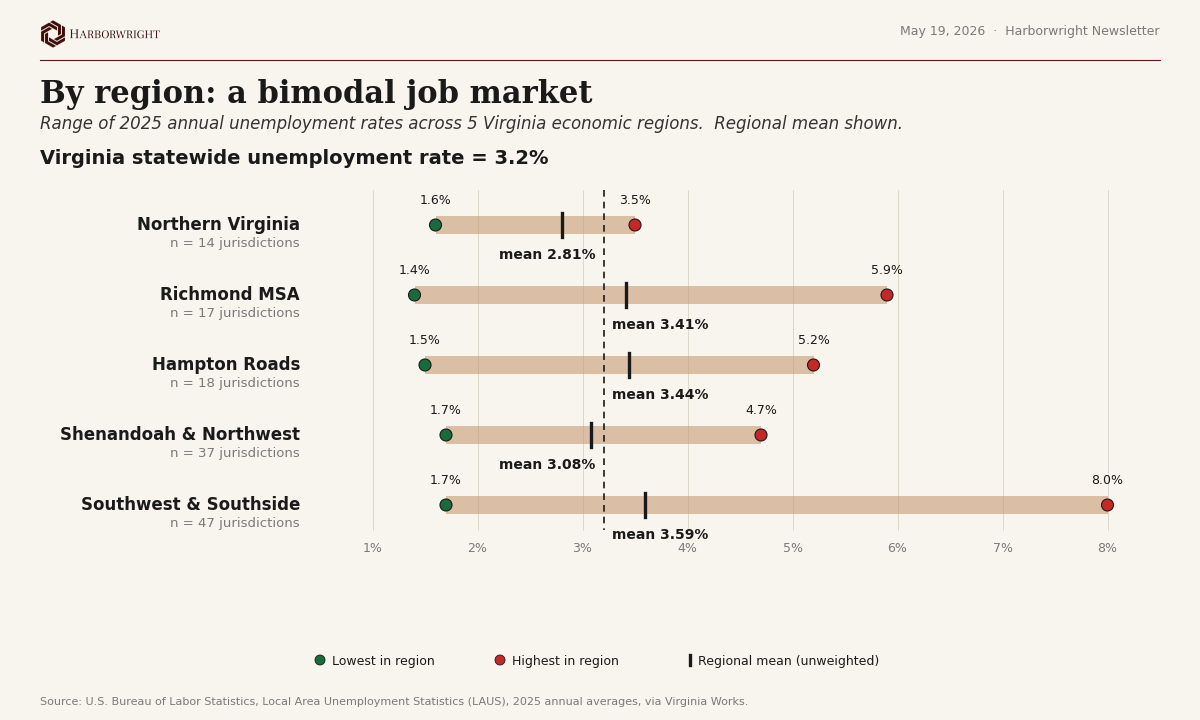
Northern Virginia runs the tightest aggregate market in the Commonwealth: a mean of 2.81% across 14 jurisdictions, with no member of the region above 3.5%. The story here is labor scarcity, not slack. The Fairfax tour stop sat in this region.
The Shenandoah & Northwest region, at a mean of 3.08%, is the second tightest. The 37 jurisdictions in this band include the Charlottesville and Harrisonburg metros and a corridor of rural counties anchored by agriculture, food processing, and higher education. The Harrisonburg tour stop sat here.
The Richmond MSA averages 3.41% across 17 jurisdictions. The range is the widest in the state: Powhatan at 1.40% at the floor, Petersburg city at 5.90% at the ceiling. The 4.5-point intra-region spread is larger than the spread across all of Northern Virginia. 2 EDOs 30 miles apart can sit at opposite ends of the state’s labor-market distribution.
Hampton Roads averages 3.44% across 18 jurisdictions. Williamsburg city (5.20%), Hampton city (4.30%), Portsmouth city (4.10%), and Norfolk city (4.00%) anchor the high end. Poquoson (1.50%) and Accomack County (1.70%) anchor the low end.
Southwest & Southside Virginia, 47 jurisdictions spanning the I-77, I-81, and U.S. 58 corridors, averages 3.59%, the highest of the 5 regions. It is also the most heterogeneous: minimum 1.70% (Buena Vista city), maximum 8.00% (Emporia city). Every Virginia jurisdiction with a 2025 unemployment rate above 5.5% sits within this region. The tour sessions in this region will be the most consequential, and the most contested.
The Summary
Virginia ended 2025 with a statewide unemployment rate of 3.20%, well below the 4.3% national average. Beneath that headline, the spread is 6.6 percentage points: Powhatan County floors the distribution at 1.40%, Emporia city tops it at 8.00%, and 131 other counties and independent cities sit between them.
The distribution is right-skewed and geographically concentrated. 14 jurisdictions sit above 4.5%, and all of the rates above 5.5% sit within the Southwest & Southside region. Independent cities make up 6 of the 10 highest unemployment rates in the state. Exurban counties make up 6 of the 10 lowest. The 0.78-point gap between Northern Virginia’s regional mean (2.81%) and Southwest & Southside’s (3.59%) is the structural problem the Governor’s tour was launched to solve.
For Virginia’s 133 economic-development offices, this map is the starting point. The tour sessions over the coming months will sort the Commonwealth’s regions into a policy framework. The Economic Development Offices that arrive understanding their own jurisdiction’s position, their tier, their peer set, and their structural ask will shape that framework. The ones that arrive with general talking points will read it after it is published.
The best way to prepare for the tour is to understand your economy and what is out there, so you can work effectively with the state and secure the jobs and wins your jurisdiction needs.
Sources
Unemployment figures are 2025 annual averages from the U.S. Bureau of Labor Statistics Local Area Unemployment Statistics (LAUS) program, retrieved and updated by Esri.